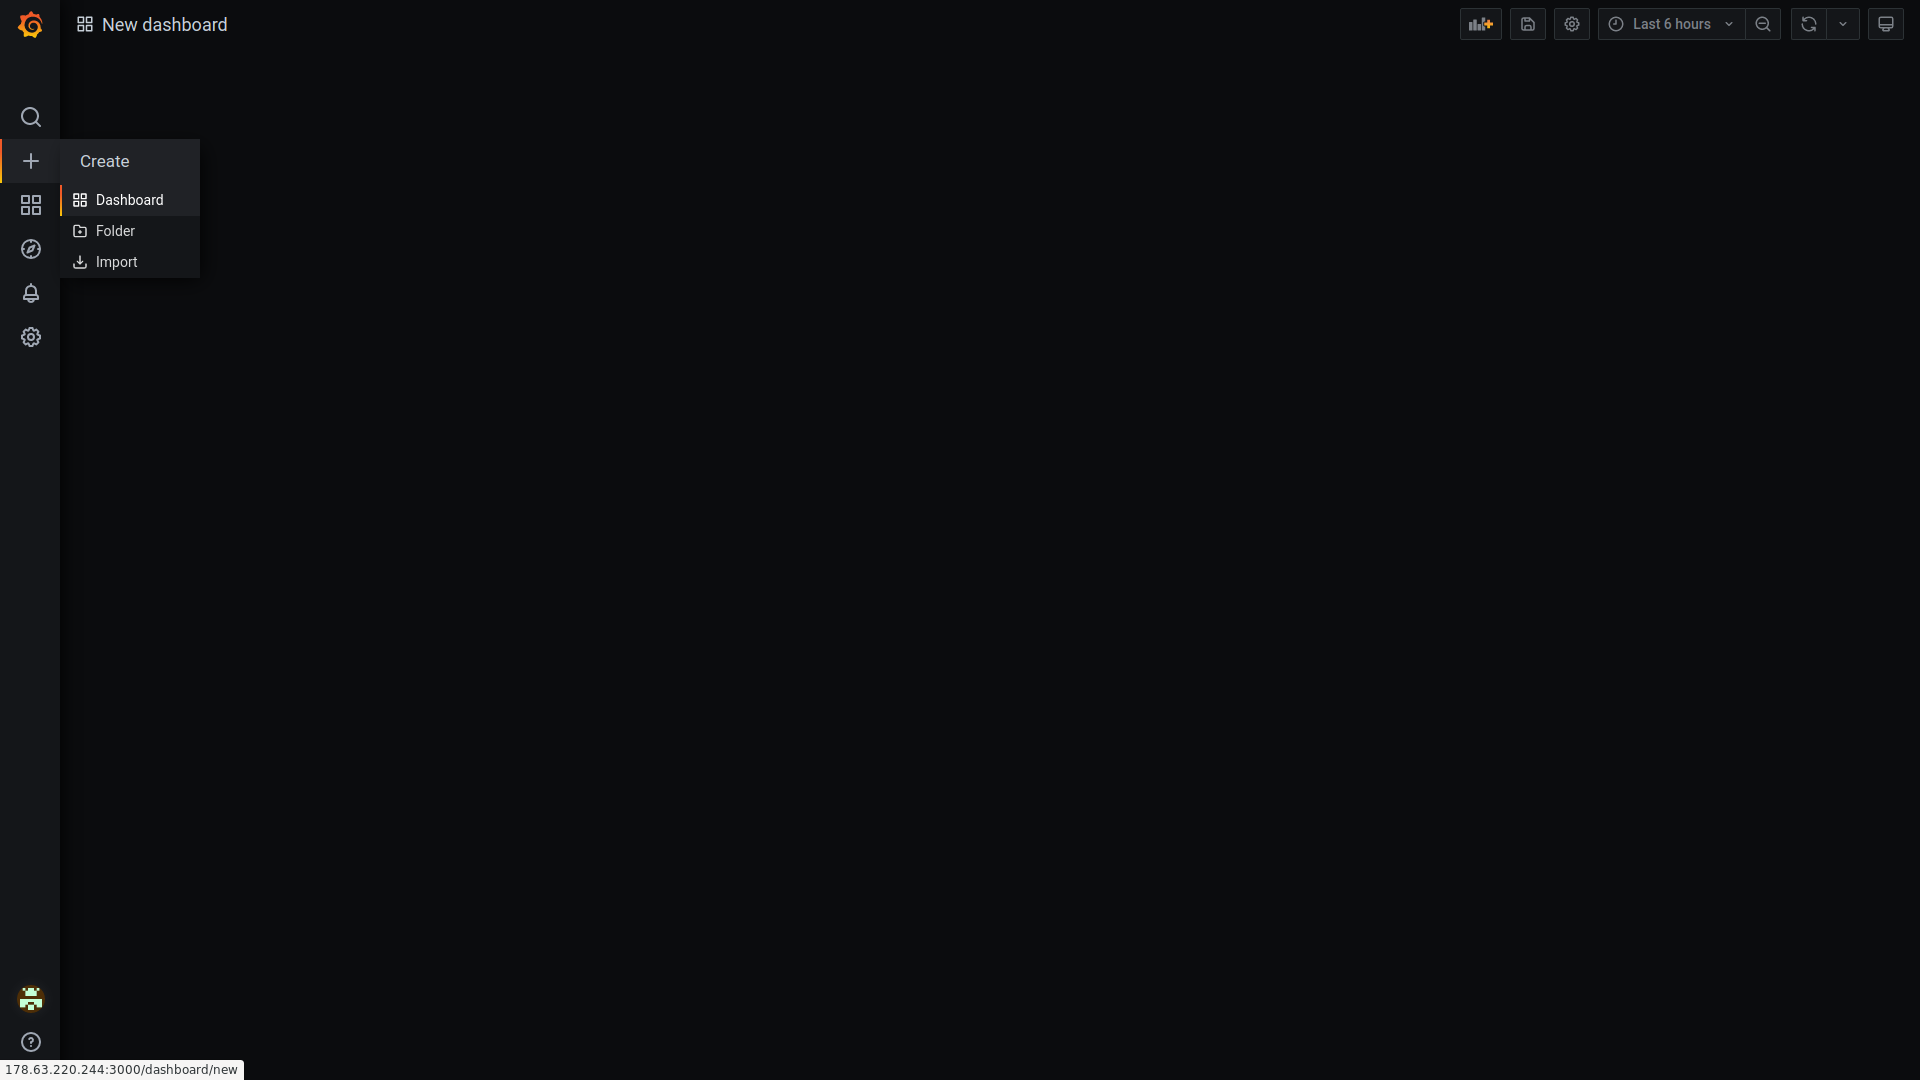
To show values from your things in Grafana you need to set up the IoTHub as datasource.
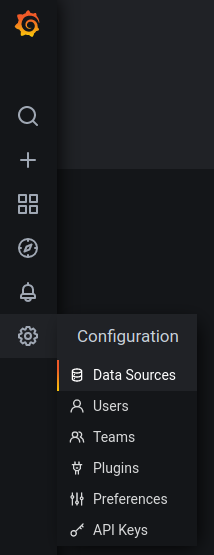
Log in to your Grafana instance and go into settings menu. Settings menu at Grafana
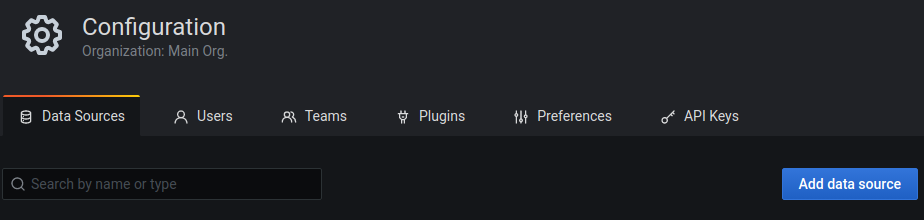
Select data sources and add a new data source. Add data source
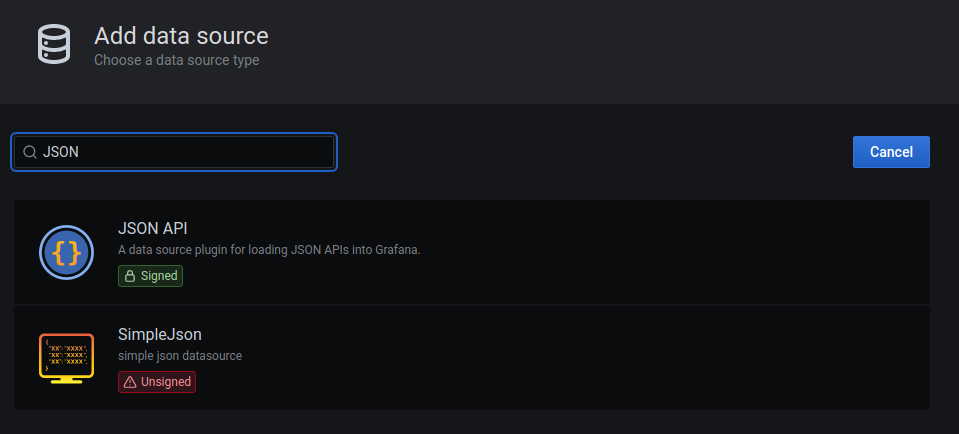
Select JSON API in others category. Add a JSON API data source
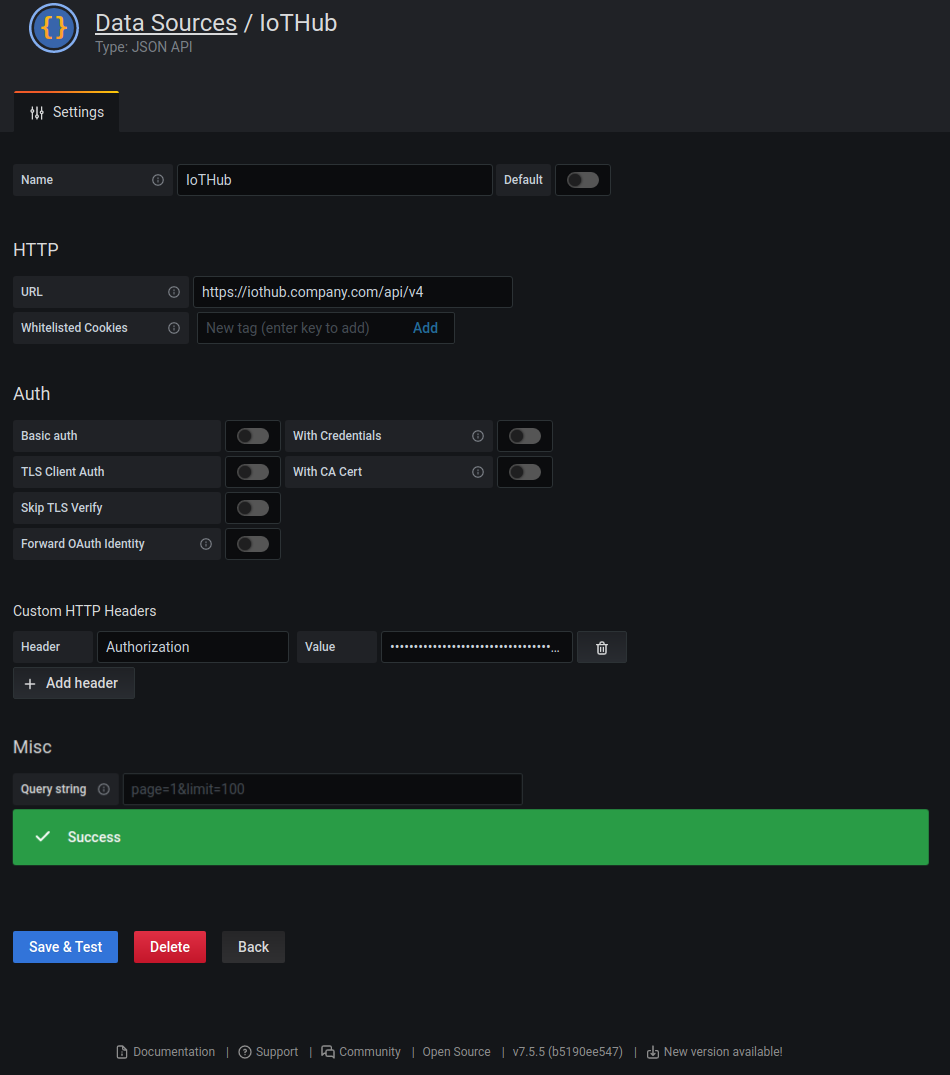
Fill out name and URL. Include the API version in URL.
Add "Authorization" as custom http header. In the value field write "Bearer", add a space and paste a IoTHub AppToken. Configure an IoTHub data source To test your settings click "Save & Test".
Important
For security reasons do not use a Super-Admin AppToken for this! Create a new user in IoTHub and assign access only to the things you want to display in Grafana.
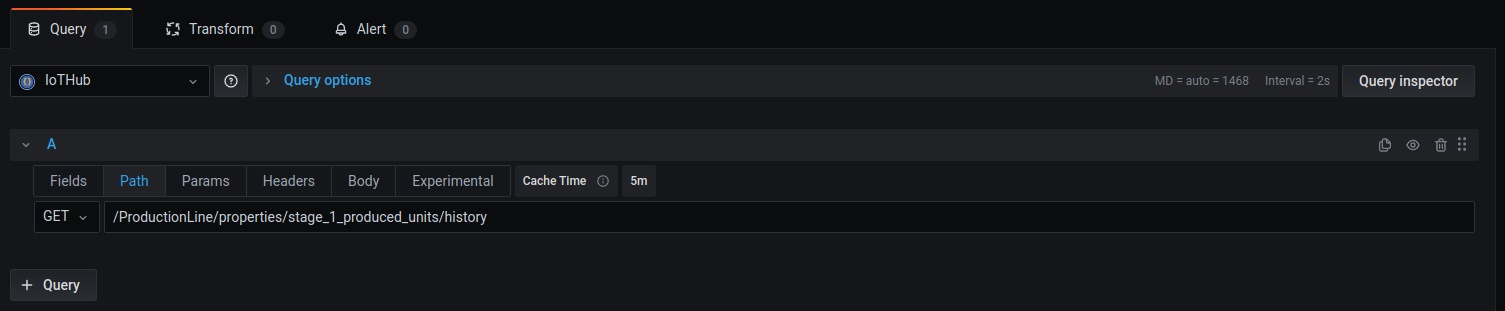
Select path and complete the API URL to the property you want to display. e.g.: Add a path to the resource
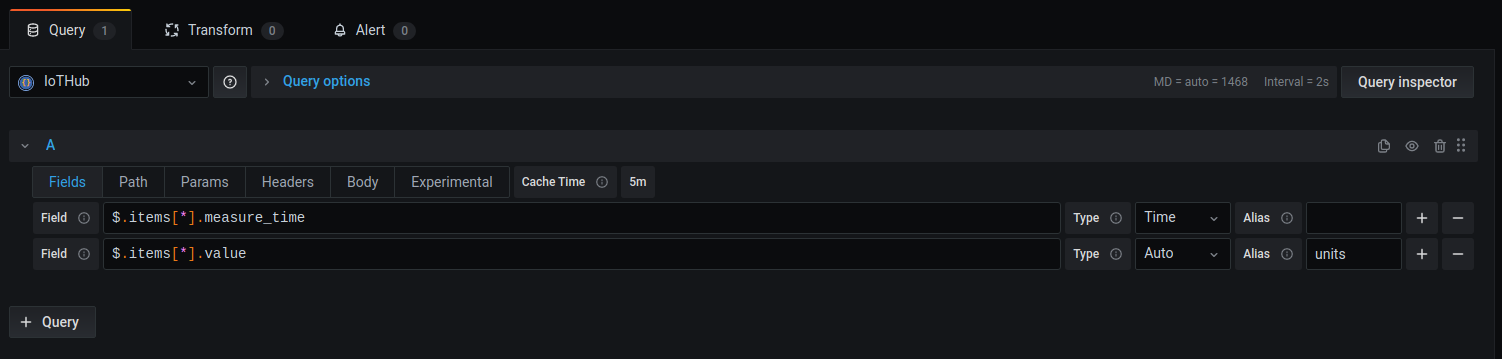
In Query Tab select the datasource of the IoTHub API, you created before. Define the fields to show: Add fields to the widget
REST API documentation
Study IoTHub API documentation for further information about the paths and usage. Switch to the fields tab and select the value in the JSON-Response you want to display. If you request properties directly, like in the example above, you simply fill out the property name. It's helpful to use a REST-Request software like Insomnia or postman to check the JSON responses from IoTHub and fill out all fields correctly. Everything is working when values are displayed in the preview.
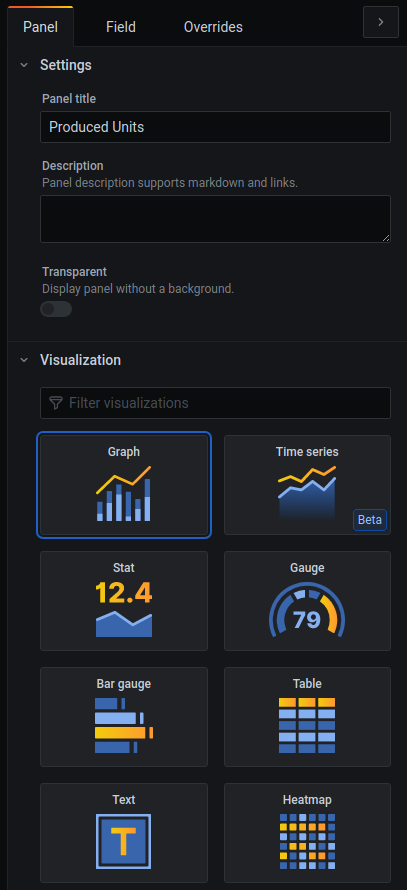
Select a graph as visualization: select visualization for the widget
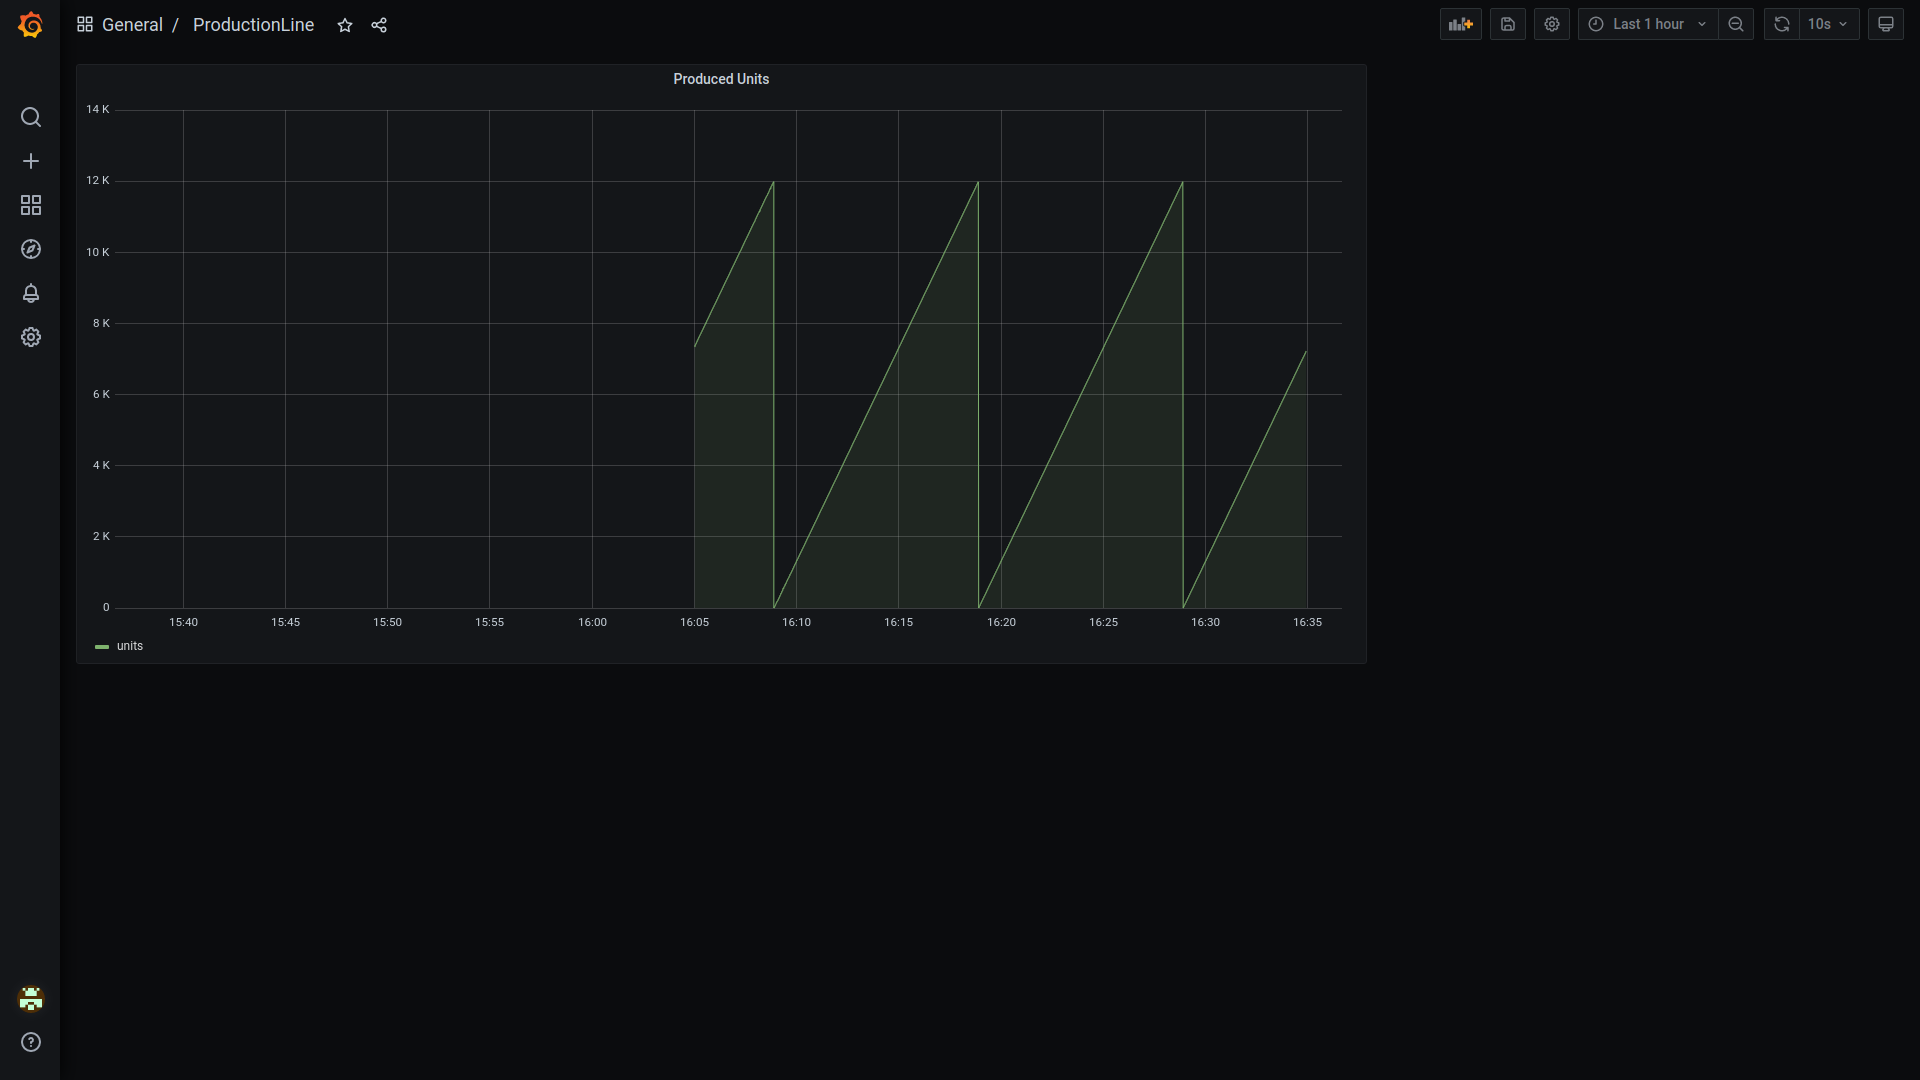
A graph widget will be created based on the historical data of the property. A running history module is required for this functionality. Historical graph at the dashboard
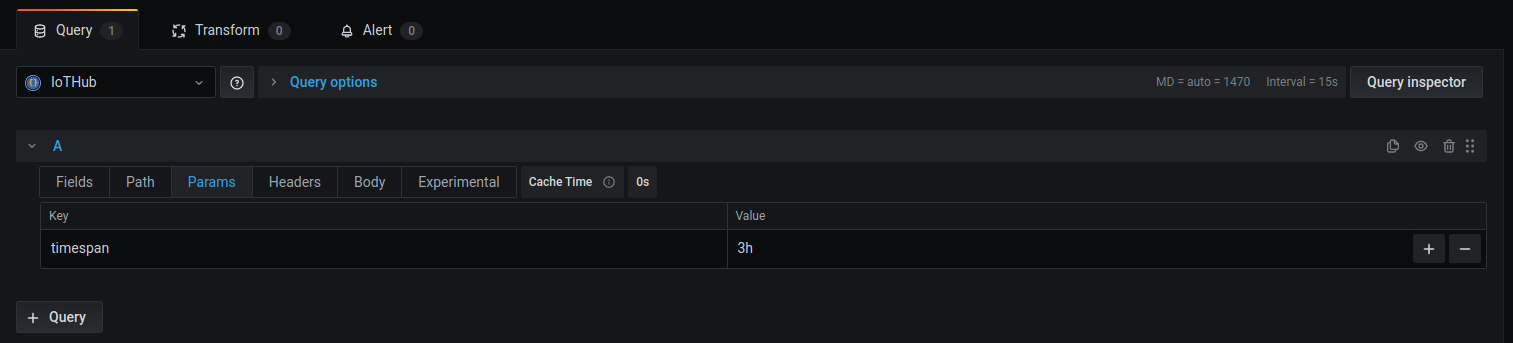
To further improve performance, go to Params Tab and add "timespan" as parameter. Use a value in hours, you want to receive data. For example to fetch the last 3 hours add 3h. This way you can minimize data traffic and improve performance. Add timespan parameter and switch off cache
Increase performance
All widgets work better with Cache Time set to 0s. Multiple graphs/values can be visualised on one panel by adding more queries to the widget.